How Coca-Cola India Created 605 Maps Without GIS Training
Coca-Cola India's 56-member strategy team created 605 district-level maps for territory planning, sales analysis, and distribution optimization all without a single GIS analyst. Here's how they did it.

March 30, 2026

When Coca-Cola India's strategy team needed detailed district-level maps of their sales territories, they faced a problem every large FMCG organization knows well: the data existed in spreadsheets, but turning it into visual, shareable maps required specialized GIS tools - and the expertise to use them.
Their strategy team wasn't made up of cartographers or GIS analysts. They were business strategists, market analysts, and territory planners. They needed a tool that could meet them where they were.
Within weeks of adopting iipmaps, team started creating maps. No training sessions. No GIS consultants. No months-long implementation.
The Challenge: Territory Maps at Scale
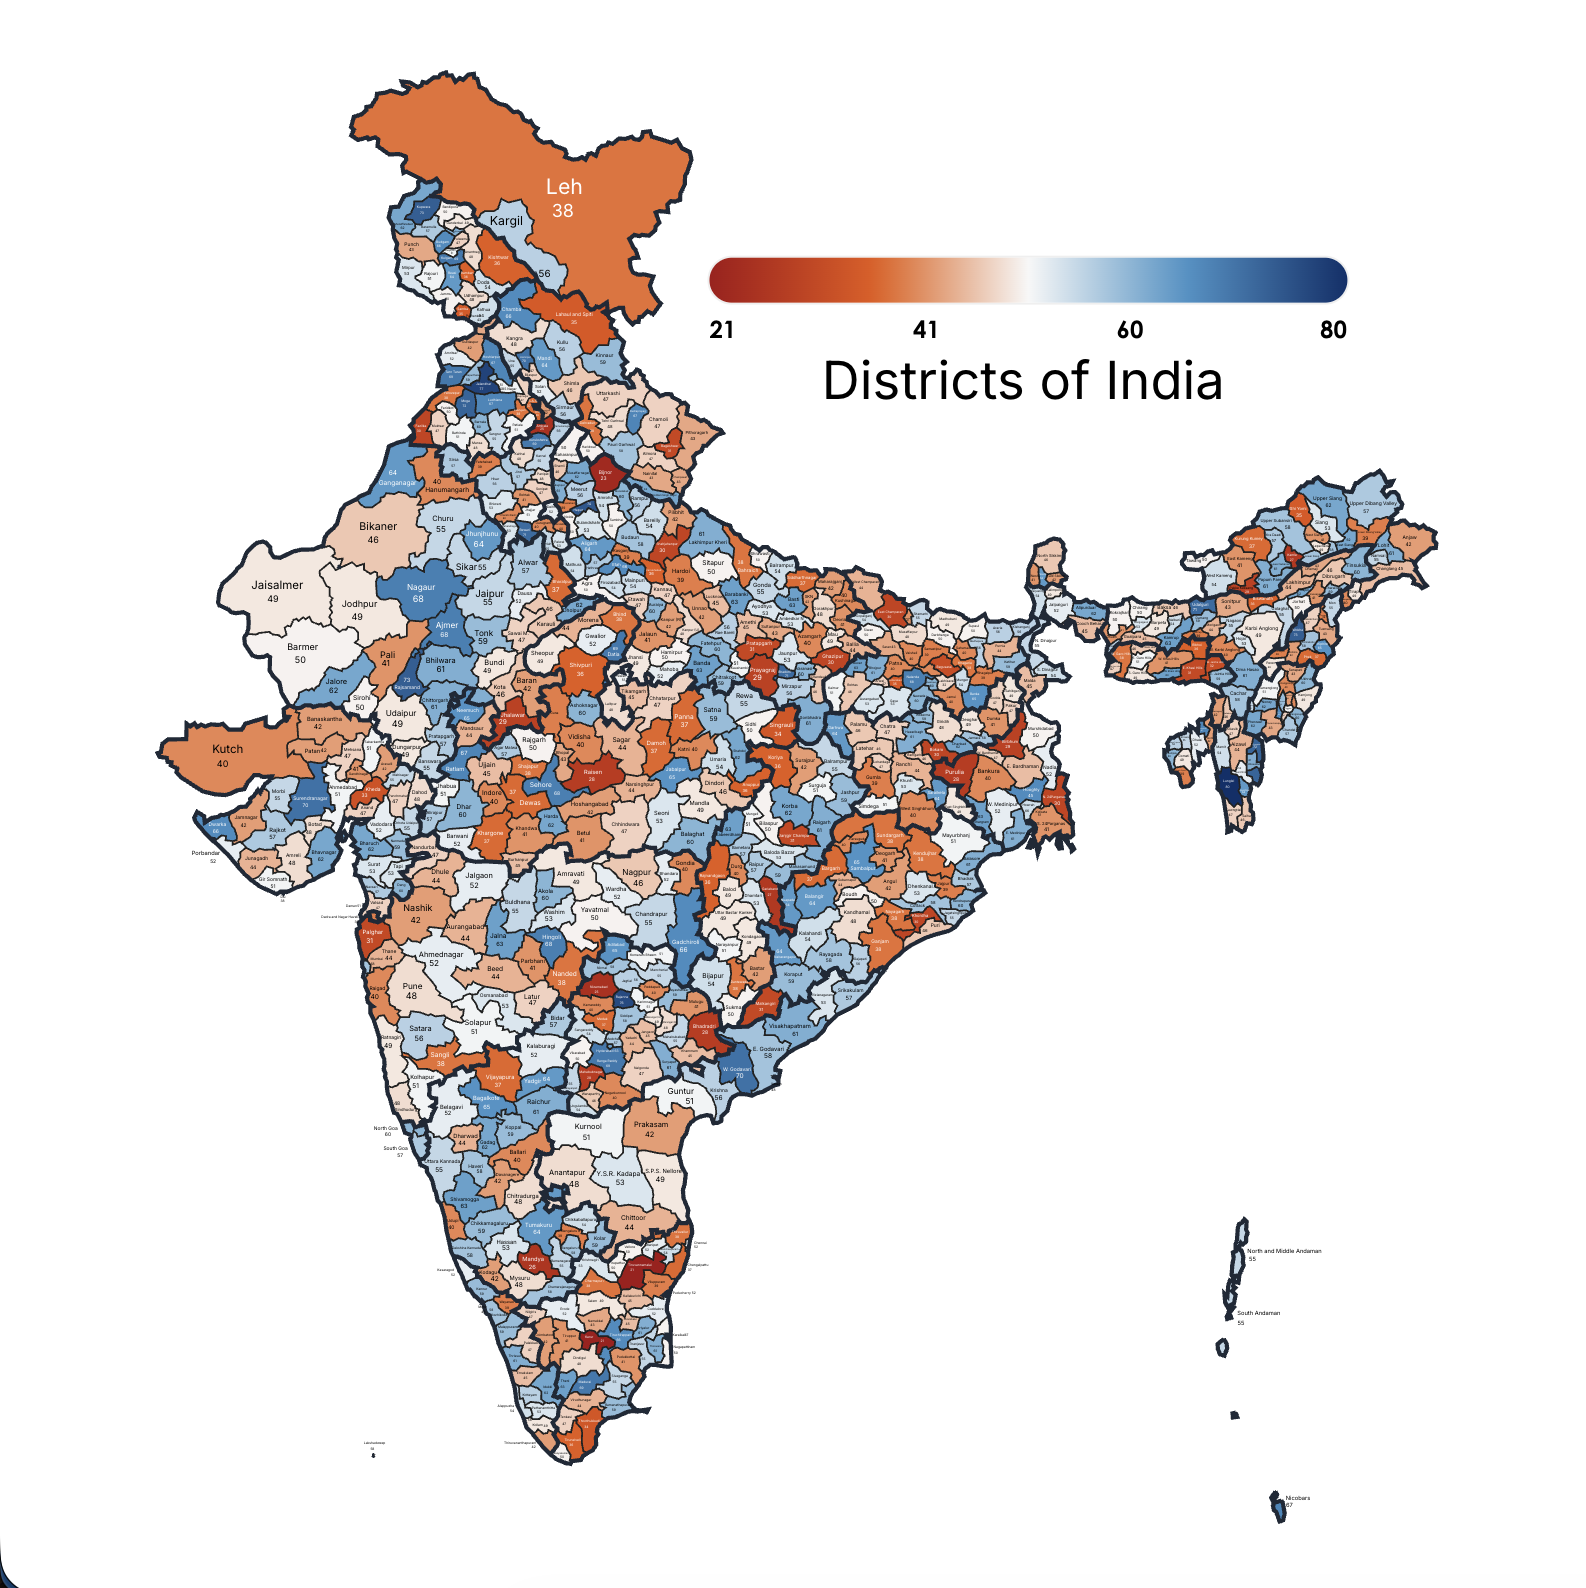
Coca-Cola India operates through a complex network of bottlers, each managing specific territories called DDRs (Direct Distribution Routes). Visualizing these territories, which bottler covers which districts, where sales are concentrated, where distribution gaps exist is critical for strategic planning.
The core requirement was deceptively simple: take data from a spreadsheet, map it to India's districts, and produce a clean, branded visual that could go into a presentation or report.
The Solution: iipmaps for Enterprise Teams
iipmaps solved the problem because it was built specifically for this use case - India-focused data visualization that doesn't require GIS expertise.
What made it work for non-technical users:
India's 700+ districts, ready out of the box. No uploading shapefiles. No hunting for boundary data. Every state, district, and union territory is already there. The team could paste their DDR data and see results immediately.
Familiar spreadsheet-style input. If you can use Excel, you can use iipmaps. The team copied data from their existing spreadsheets, pasted it into iipmaps, and had a map in minutes. The interface felt familiar, not foreign.
Export-ready outputs. Every map was created for a purpose, a board presentation, a regional review, a territory planning document. iipmaps high-resolution exports (PNG, SVG) meant maps went directly from the tool into the final deliverable.
The Results: 605 Maps and Counting
The numbers tell the story:
605 maps created across the strategy team
56 users actively creating maps from senior directors to analysts
Zero GIS training required - the tool was picked up within minutes
Standardized visual language for market analysis across the organization
The maps are used for:
DDR territory planning - visualizing which bottler covers which districts
Sales performance analysis - comparing performance across regions
Distribution network optimization - identifying gaps in coverage
Market penetration studies - understanding where products reach and where they don't
"Easy to use, picked up quickly by non-technical folks. Granular district-specific maps that alternatives don't offer."
— Kaustuv Gupta, Senior Director Strategy, Coca-Cola (now Africa Operations)
Why This Matters for FMCG and Enterprise Teams
Coca-Cola's experience highlights a pattern we see across large organizations working with India-specific data:
The data already exists - in spreadsheets, databases, and CRMs. The bottleneck is visualization, not data collection.
The people who need maps aren't GIS experts - they're strategists, analysts, and managers who need visual answers to business questions.
India's geography is uniquely complex - 700+ districts across 28 states and 8 union territories. Generic mapping tools don't handle this well out of the box.
Brand consistency matters at scale - when 56 people are creating maps, they need to look like they came from one organization.
iipmaps was built to close exactly this gap: between the data organizations already have and the India-specific visualizations they need, without requiring a GIS team to bridge it.
Getting Started
If your team creates India-focused maps for territory planning, market analysis, reporting, or presentations, iipmaps can help you move from spreadsheets to visuals in minutes.
Try iipmaps free - create your first district-level map in under 5 minutes
Enterprise plans - for teams that need brand consistency, collaboration, and dedicated support
