Hottest year on record: 2026 is likely to beat 2024
2023, 2024 and 2025 were the three warmest years on record, and 2026 is on course to beat them all as a strong El Niño builds. Here is the global climate data, and what it means for India.

October 30, 2026
In 30 seconds
1.47 °C: 2025 was the third-warmest year on record, so 2023, 2024 and 2025 are the three hottest years ever measured (Copernicus).
93%: the chance that 2026 becomes the hottest year on record, as a strong El Niño builds (Berkeley Earth, September 2026).
+0.28 °C: India's milder 2025, only its 8th warmest year (IMD); the 2026 monsoon then ended 13% short as El Niño set in (IMD).
Source: Copernicus ERA5 via Our World in Data, 2025. How much warmer each country's land was than its 1991-2020 average, in °C. Hover or tap a country for its value.
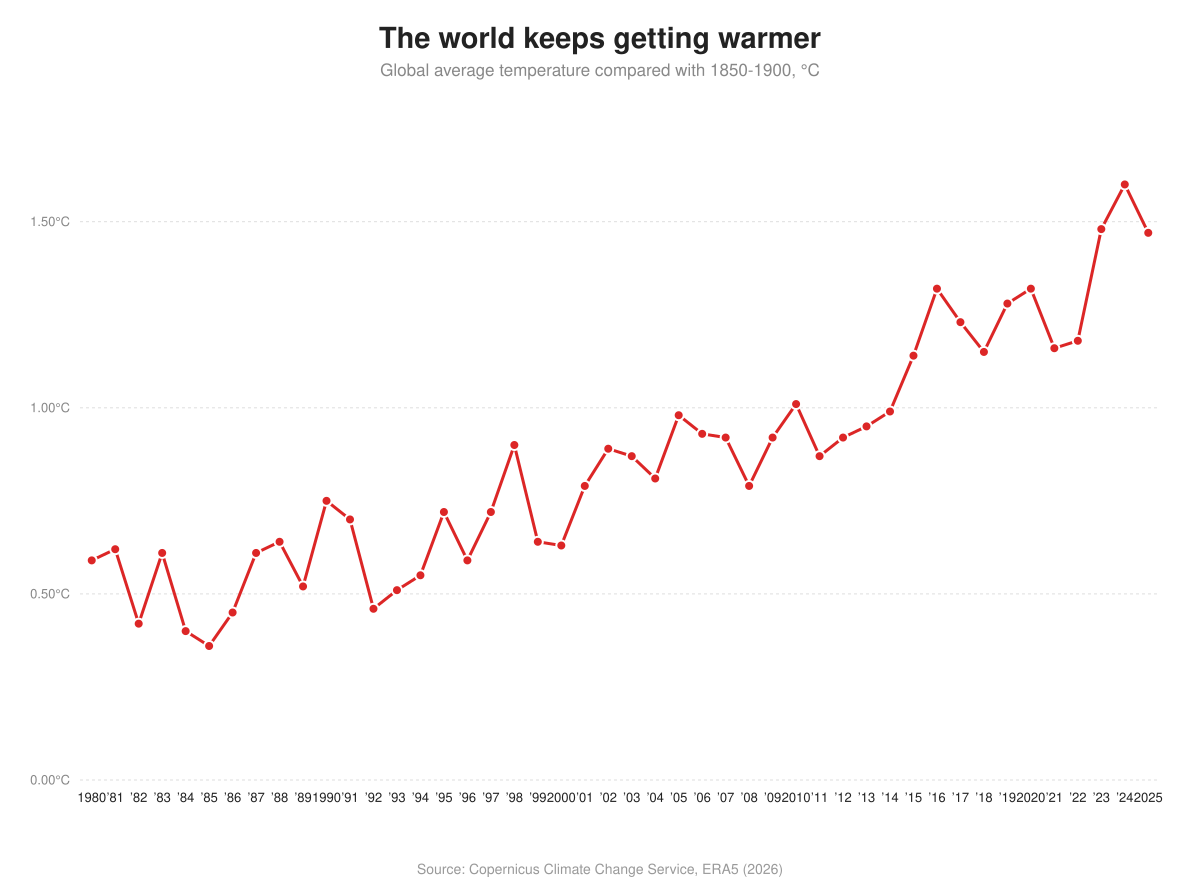
The world has just had its three hottest years on record, and 2026 is on course to be the next. Copernicus puts 2025 at 1.47 °C above the 1850-1900 average, behind 2024 (1.60 °C) and 2023 (1.48 °C).
On the map, India was close to normal in 2025, while neighbours Pakistan and Nepal had their warmest year in this dataset (Our World in Data). But the El Niño now building has already reached India's weather, starting with the monsoon.
2023, 2024 and 2025 were the three warmest years on record
1.47 °C left 2025 just 0.01 °C behind 2023 and 0.13 °C behind 2024, which still holds the record (ECMWF, January 2026). The past 11 years were the 11 warmest on record.
And 2025 got there without help from the Pacific. It "started and ended with a cooling La Niña and yet it was still one of the warmest years on record", said the World Meteorological Organization (WMO).
In Copernicus data, 2023-2025 was the first three-year stretch to average above 1.5 °C. The WMO's combined figure is 1.48 °C, just under it.
Source: Copernicus Climate Change Service, ERA5, via the Met Office climate dashboard (compared with 1850-1900), 2026.
Will 2026 be the hottest year on record?
93% was Berkeley Earth's estimate on 24 September that 2026 sets a new record, up from about 69% a month before (Berkeley Earth). That is a big shift. In December the Met Office had only called 2026 "likely one of the four warmest years".
Since then, January to September 2026 averaged 1.49 °C above pre-industrial, second only to the same months of 2024 (our average of the Copernicus monthly data). August 2026 tied July 2023 as the warmest month in that record, and the ocean surface had its warmest September on record.
El Niño, a warming of the tropical Pacific, is pushing heat into the air. Sea temperature in the Pacific's Niño 3.4 region reached 29.70 °C in September, the highest of any month since 1979. "We are in a new run of months above 1.5°C, and with a strong El Nino still intensifying it is likely to last into 2027," said Carlo Buontempo, director of the Copernicus Climate Change Service, according to Down To Earth.
What the hottest years mean for India
+0.28 °C is how far India's 2025 ran above its 1991-2020 average, making it only the 8th warmest year since 1901, says the India Meteorological Department (IMD). 2024 is still India's record, at +0.65 °C. The map uses a different dataset and puts India at +0.07 °C.
May, normally the worst of the heat, was cooler than usual and the wettest May on record, IMD says. India counted 182 heatwave days in 2025, against 554 in 2024 (Ministry of Earth Sciences). Our heatwave post maps where they fell.
2026 is different. The monsoon ended 13% below normal, and IMD's season report says El Niño developed in June and was strong by the season's end (IMD, September 2026).
Carbon dioxide passed 432 ppm in May 2026
427.35 ppm of carbon dioxide was the 2025 average at Mauna Loa, Hawaii, up from 315.98 ppm in 1959 (NOAA). Carbon dioxide traps heat, which is why this chart and the temperature chart climb together.
The yearly rise slowed to 2.23 ppm in 2025, from about 3.3 ppm in 2023 and 2024. Slower is not falling. May 2026 still hit 432.34 ppm, NOAA's highest monthly value, and 432.00 ppm in the separate Scripps record.
Trees absorb some of that carbon, yet the world lost 25.5 million hectares of tree cover in 2025, 42% of it to fire (WRI). Our forest post covers India.
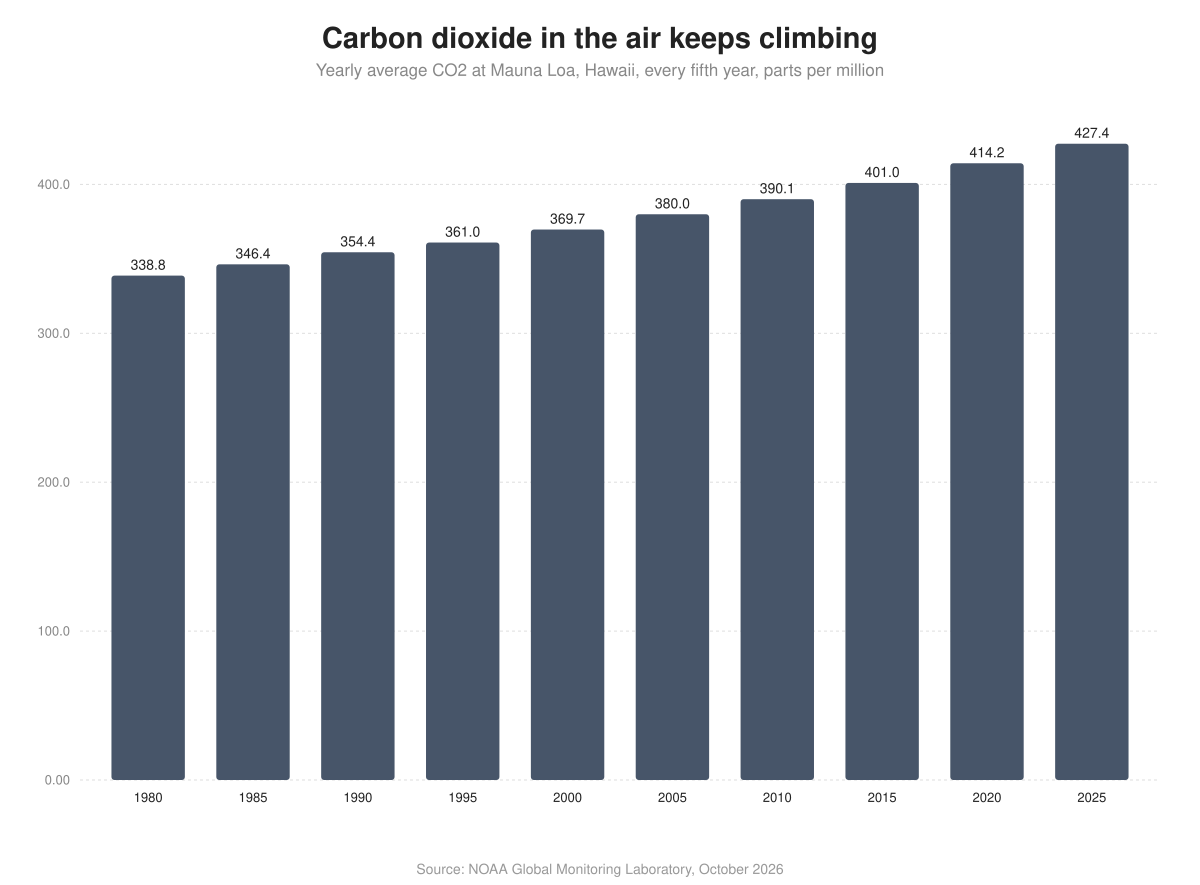
Source: NOAA Global Monitoring Laboratory, Mauna Loa annual means, October 2026.
Arctic summer ice has shrunk by more than a third since the 1980s
4.60 million sq km was all the Arctic sea ice left at its 2026 low, likely reached on 12 September. That ties for 10th smallest since 1979 and is 1.62 million sq km below the 1981-2010 average (NSIDC, preliminary).
Single years bounce around, so the decade averages are a better guide. The yearly low averaged 6.99 million sq km in the 1980s and 4.40 million in 2020-2025, 37% less (our calculation from NSIDC data). The 20 lowest minimums all came in 2007-2026, say NASA and NSIDC.
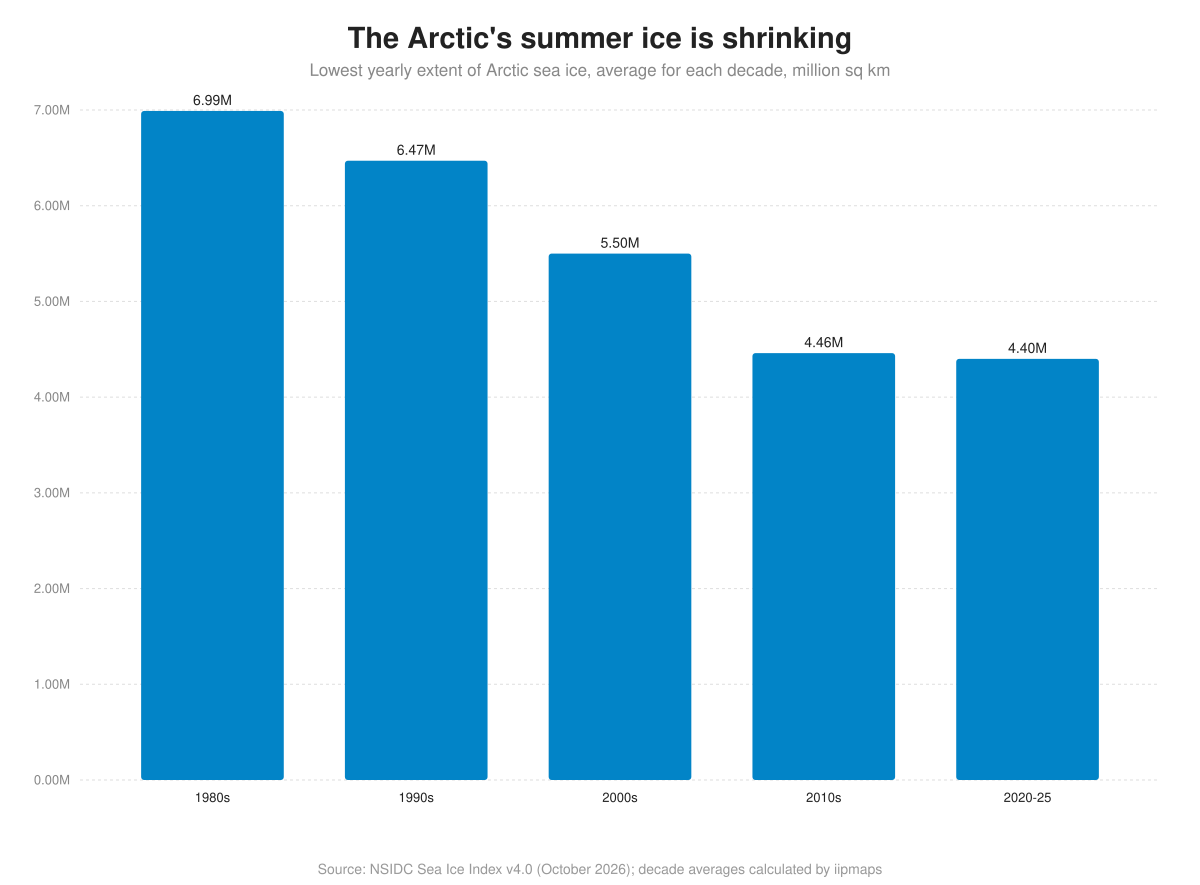
Source: NSIDC Sea Ice Index v4.0, October 2026. Decade averages calculated by iipmaps; 1980s means 1980-1989 and 2020-25 means 2020-2025.
What the numbers do not show
One hot year does not break the Paris limit. The 1.5 °C goal is about long-term warming, "typically assessed over 20 years" (WMO).
The map compares 2025 with 1991-2020, over land only, so its numbers look smaller than the headline; on its scale the world was 0.59 °C above normal. We used Our World in Data's country figures because no agency publishes an official country table for 2025.
The 2026 sea ice low is preliminary. The UK Met Office, using another index, puts it at 5.06 million sq km, 14th lowest.
The Copernicus website was down for maintenance when we checked on 22 October 2026, so Buontempo's words come from Down To Earth. The numbers come from Copernicus data files.
What comes next
86%: the WMO's chance that at least one year from 2026 to 2030 beats 2024; it gives 75% for the 2026-2030 average topping 1.5 °C (WMO, May 2026). Copernicus says the long-term limit "could be reached by the end of this decade".
83%: NOAA's chance that this El Niño becomes the strongest since 1950 in October-December, with a strong event likely through March 2027 (NOAA, October 2026).
2.3 to 2.5 °C: warming this century if every country meets its pledge, and up to 2.8 °C on current policies (UNEP Emissions Gap Report 2025, via co-author PBL).
170 billion tonnes: the CO2 left from the start of 2026 for a 50% chance of holding warming to 1.5 °C, about four years of 2025 emissions (Global Carbon Budget).
No India outlook yet: IMD has not forecast the 2027 summer. Its 2026 hot-season outlook came on 28 February.
How this map stays current
The world map here is a live iipmaps embed. When the 2026 country figures come out, one update will reach every page that carries it. On a paid plan, a newsroom can link a map like this to a Google Sheet and it updates on its own. Our post on live maps instead of screenshots explains how.
Frequently asked questions
Is 2026 the hottest year on record?
Not yet. Berkeley Earth gives it a 93% chance. Copernicus and the WMO gave their 2025 verdicts on 14 January 2026, so expect the 2026 ones in January 2027.
Has the world crossed the 1.5 °C Paris limit?
Not officially. Single years and the 2023-2025 average topped 1.5 °C in Copernicus data, but the Paris goal is measured over about 20 years.
Why do Copernicus and the WMO give different numbers?
Copernicus uses its ERA5 dataset; the WMO combines several. For 2025 Copernicus says 1.47 °C and the WMO about 1.43 °C, "second or third hottest" depending on the dataset.
Sources
WMO: 2025 temperature, 14 January 2026; State of the Global Climate 2025, 23 March 2026; decadal update, 28 May 2026
Copernicus bulletin data, September 2026: global temperature, sea surface, Niño 3.4
IMD: Climate of India during 2025; press release, 1 October 2026; monsoon 2026 salient features; March-May 2026 outlook
NOAA Mauna Loa CO2: annual, growth, monthly; Scripps, 11 June 2026
Sea ice: NSIDC, 23 September 2026; NSIDC rankings; NASA; Met Office
Global Carbon Budget, 13 November 2025; Friedlingstein et al., ESSD, 13 May 2026