Live maps, not screenshots: publish maps that stay correct
A screenshot of a map is right only on the day it was taken. A live map is one map that every page points to, so one fix reaches all of them. Here is when that matters, how it works and what it costs.

October 30, 2026
In 30 seconds
1 update reaches every page. Fix a number once and every page that embeds the map shows the fix.
13% below normal: India's 2026 monsoon, in the live map below. If final state figures differ, one edit corrects every copy.
Every 15 minutes on Pro, and every minute on Enterprise, iipmaps checks a linked Google Sheet. The free plan publishes live maps with 3 updates each.
Source: IMD data for 1 June to 29 September 2026, as reported by Down To Earth (30 September 2026). No figure was published for Chandigarh.
Live maps fix a problem every newsroom knows: last month's story still shows last month's numbers. A screenshot freezes the data on the day someone took it. A live map lives in one place and every page that shows it points there, so one change reaches all of them.
The map above is a live iipmaps map. India got 87% of its normal monsoon rain in 2026, which IMD's 1 October update rounds to 13% short. Meghalaya got 60% less than normal, according to IMD data reported by Down To Earth.
A screenshot is right only on the day you take it
One day separates the state numbers on this map from the end of the season. They stop at 29 September because IMD overwrites its state rainfall PDF daily and the 30 September table is no longer online. IMD's Shimla office later put Himachal Pradesh's season at -11%, one point below the -10% in the 29 September figures.
Fixing a screenshot means making a new picture and swapping it into every page that used the old one. A live map needs one edit.
Old pages stay up long after they stop being right. Pew Research Center found in 2024 that 23% of news webpages had at least one broken link. We found no study of how often embedded screenshots go stale, but a screenshot has no way to tell anyone it is out of date.
Most readers never click, so the case is accuracy
85% of readers ignore interactive graphics, or so the often-repeated claim goes. Gregor Aisch explained in 2017 that the figure came from clicks on one button in a couple of 2015 graphics: those readers "didn't ignore the graphic, they just didn't click the button."
Still, few readers explore. Archie Tse of The New York Times told the Malofiej conference in 2016: "If you make a tooltip or rollover, assume no one will ever see it." A 2024 study in Digital Journalism found interactive charts made people process the numbers more carefully, which helped them judge the issue more accurately.
That is why we make the case for live maps on accuracy rather than clicks. Every page shows the current number, and nobody has to remember to swap a file.
One update reaches every page that shows the map
One address per map does the work. Every published iipmaps map has a page at iipmaps.com/e/ plus its ID. A news site, a WordPress post and an AMP article can all show that map, and open pages check for new data every 30 seconds while it is on screen.
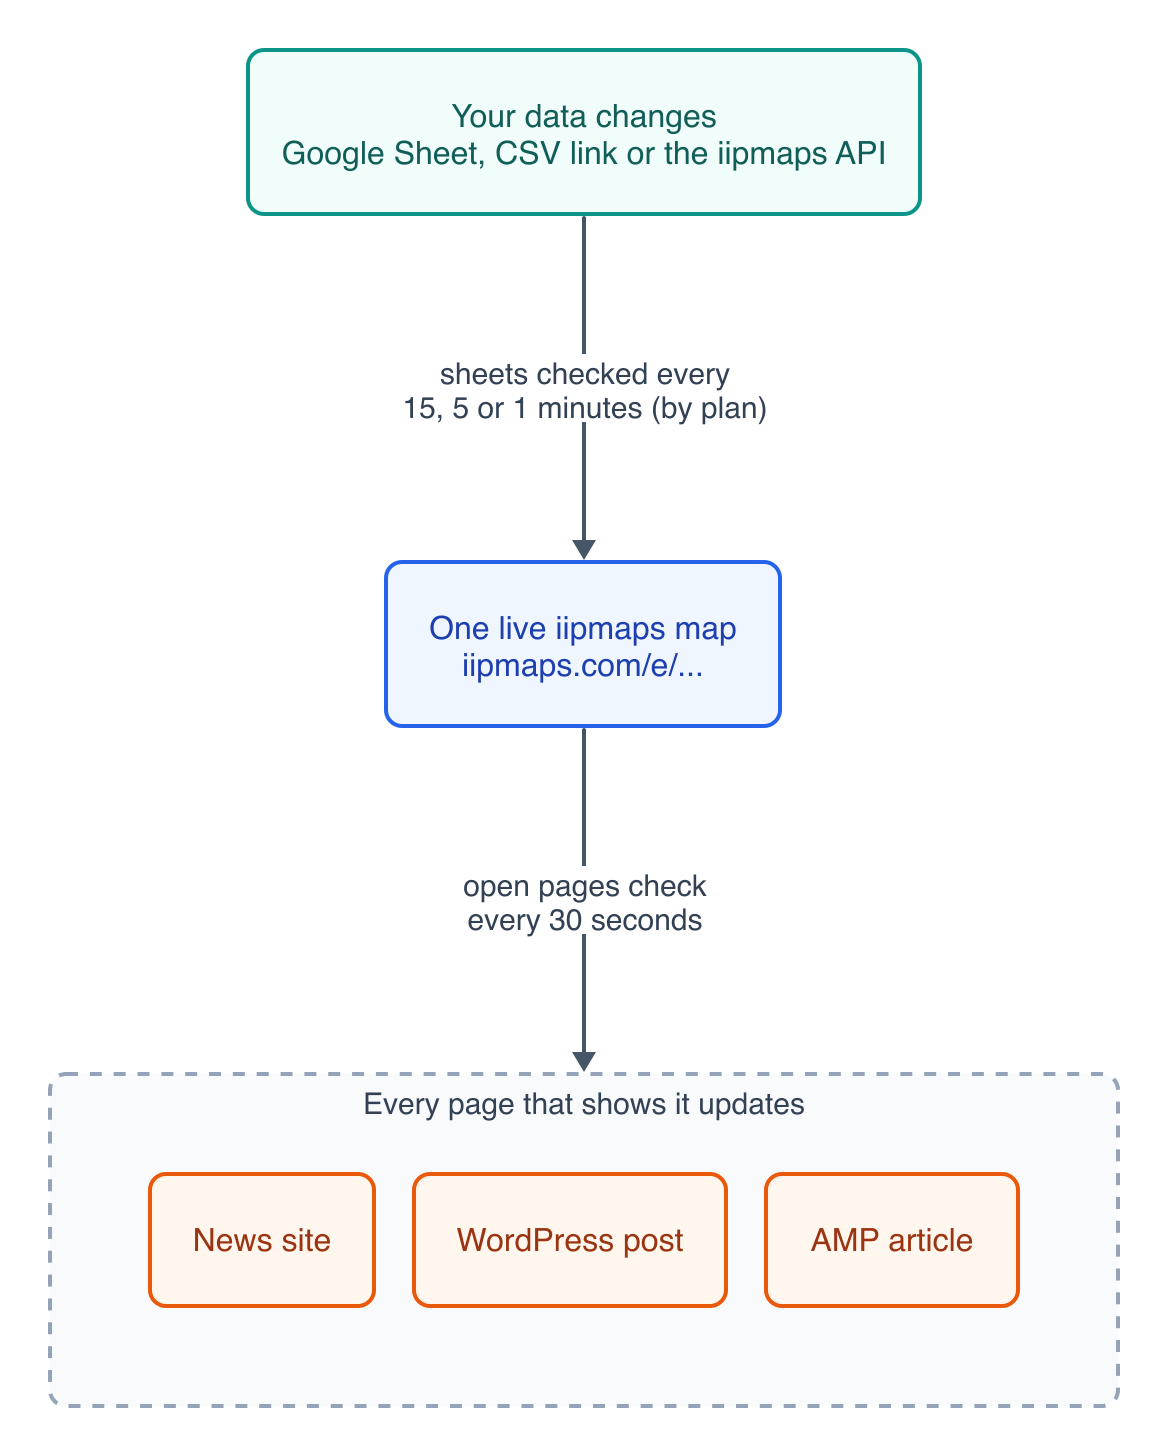
Source: iipmaps, October 2026.
A newsroom can run one state map in its live blog, its explainer and its AMP pages, and fix a wrong figure once. Partners of an NGO can embed its district map without old copies piling up. When a government data office publishes one map that ministries and newspapers embed, they all show the same figure. And if a wrong number slips out, iipmaps keeps 50 versions of each map, so you can roll back.
How do I embed a live map on WordPress, AMP or any website?
Six embed options sit in the Share panel of the iipmaps editor:
Responsive: an iframe that resizes itself to the map's height.
iframe: a fixed 800 px frame, for sites that strip scripts.
Link: the plain iipmaps.com/e/ address.
WordPress: the same link, which WordPress turns into an embed through oEmbed.
AMP: an amp-iframe snippet for AMP pages.
Image: a PNG of the last published version, for print, newsletters or slides.
Here is another live embed, from our post on India's heatwave days in 2025 and 2026.
Source: IMD, via the Ministry of Earth Sciences' answer to Lok Sabha Unstarred Question 4494 (20 August 2025). Each state shows its worst-hit IMD weather region.
How do I keep a live map updated from a Google Sheet?
Every 15 minutes on Pro, and every minute on Enterprise, iipmaps checks a linked Google Sheet or CSV link and updates the map. The sheet must be viewable by anyone with the link, and you pick the region and value columns. If it fails 3 checks in a row, you get a notice and the map keeps its last good data.
That is not real-time. A rainfall table kept in a spreadsheet does not need it to be.
Teams with their own systems can use the Data API on Enterprise. One request updates a number map. Regions you send get new values, regions you leave out keep theirs, and null clears one.
curl -X PUT "https://iipmaps.com/api/v1/embeds/e_YOUR_EMBED_ID/data" \
  -H "Authorization: Bearer ik_YOUR_API_KEY" \
  -H "Content-Type: application/json" \
  -d '{"values": {"Kerala": -28, "Meghalaya": -60}}'
Election results and COVID trackers show what is at stake
3 crore (30 million) hits a minute was the average load on the Election Commission's ECINET on counting day for the 2026 assembly elections, All India Radio reported.
On Lok Sabha counting day in 2024, ECI said results would be on results.eci.gov.in. When a Congress delegation said the data was "not updating timely" after 2.30 pm, the Commission replied that it was "being updated as it is being received from the counting centers." Readers trust the number in front of them, so it should come from one source that updates.
By April 2020 the Financial Times' coronavirus tracker was the site's most viewed article of all time. Johns Hopkins University's dashboard drew "a staggering 2.5 billion views" before it stopped updating on 10 March 2023. India's volunteer-run covid19india.org shut on 31 October 2021. Plan for the day a live map stops, and say so on the map when it does.
What a live map costs
Live maps are a paid, business-tier feature on the big international tools. Datawrapper's paid plans start at $21 per user a month, and a chart whose data it hosts stops updating 30 days after publishing (Datawrapper pricing page, checked 30 October 2026; Datawrapper Academy, December 2021). Flourish offers live data only on its Publisher and Enterprise plans, both priced on request (Flourish pricing page, checked 30 October 2026).
iipmaps Pro is ₹899 a month or ₹8,999 a year, about $10 a month outside India (prices on 30 October 2026). That includes linked Google Sheets, unlimited updates and the badge reduced to a small link. The free plan publishes live maps with 3 updates each. And only iipmaps draws India on its official borders, down to all 785 districts.
What the free plan does and does not do
3 updates per live map is all the free plan allows. You can make as many maps as you like and publish them live, but each shows a "Made with iipmaps" badge, linked sheets are not included, and exports carry a watermark.
Pro adds unlimited updates, automatic updates when you save, and linked sheets. Verified newsrooms can get Pro free for the election season if they keep the "Made with iipmaps" link on their maps. Apply here.
Where to start
Try it free. Publish one live map of your own data. Our tutorial turns IMD's rainfall PDF into a live map step by step.
Link a sheet on Pro once a map needs regular updates.
Talk to us about the Enterprise API if your data lives in your own system. Get in touch.
Frequently asked questions
Is a live iipmaps map real-time?
No. Open pages check for new data every 30 seconds, and linked sheets are checked every 15 minutes on Pro or every minute on Enterprise. Enterprise's live event mode makes open pages check every 10 seconds.
What if my sheet breaks or someone types a wrong number?
After 3 failed checks in a row you get a notice, and the map keeps its last good data. If a wrong number is published, you can roll back to any of the last 50 versions.
Can I still get a picture for print or social media?
Yes. The Image option in Share gives a PNG of the last published version.
Sources
IMD, Salient Features of the 2026 Southwest Monsoon Season, 30 September 2026
IMD, Current Weather Status and Extended Range Forecast, 1 October 2026
IMD Meteorological Centre Shimla, HP Monsoon Report 2026, October 2026
Ministry of Earth Sciences, Lok Sabha Unstarred Question 4494, 20 August 2025
Pew Research Center, When Online Content Disappears, 17 May 2024
Gregor Aisch, In defense of interactive graphics, 31 March 2017
All India Radio, ECINET in the 2026 assembly elections, 6 May 2026
All India Radio, Lok Sabha counting arrangements, 3 June 2024
All India Radio, Congress delegation meets Election Commission, 4 June 2024
Press Gazette, data-driven visual journalism on coronavirus, 9 April 2020
Fox TV Stations with AP, Johns Hopkins COVID tracker shuts down, 13 March 2023
Down To Earth, India's major COVID-19 website shuts, 2 November 2021