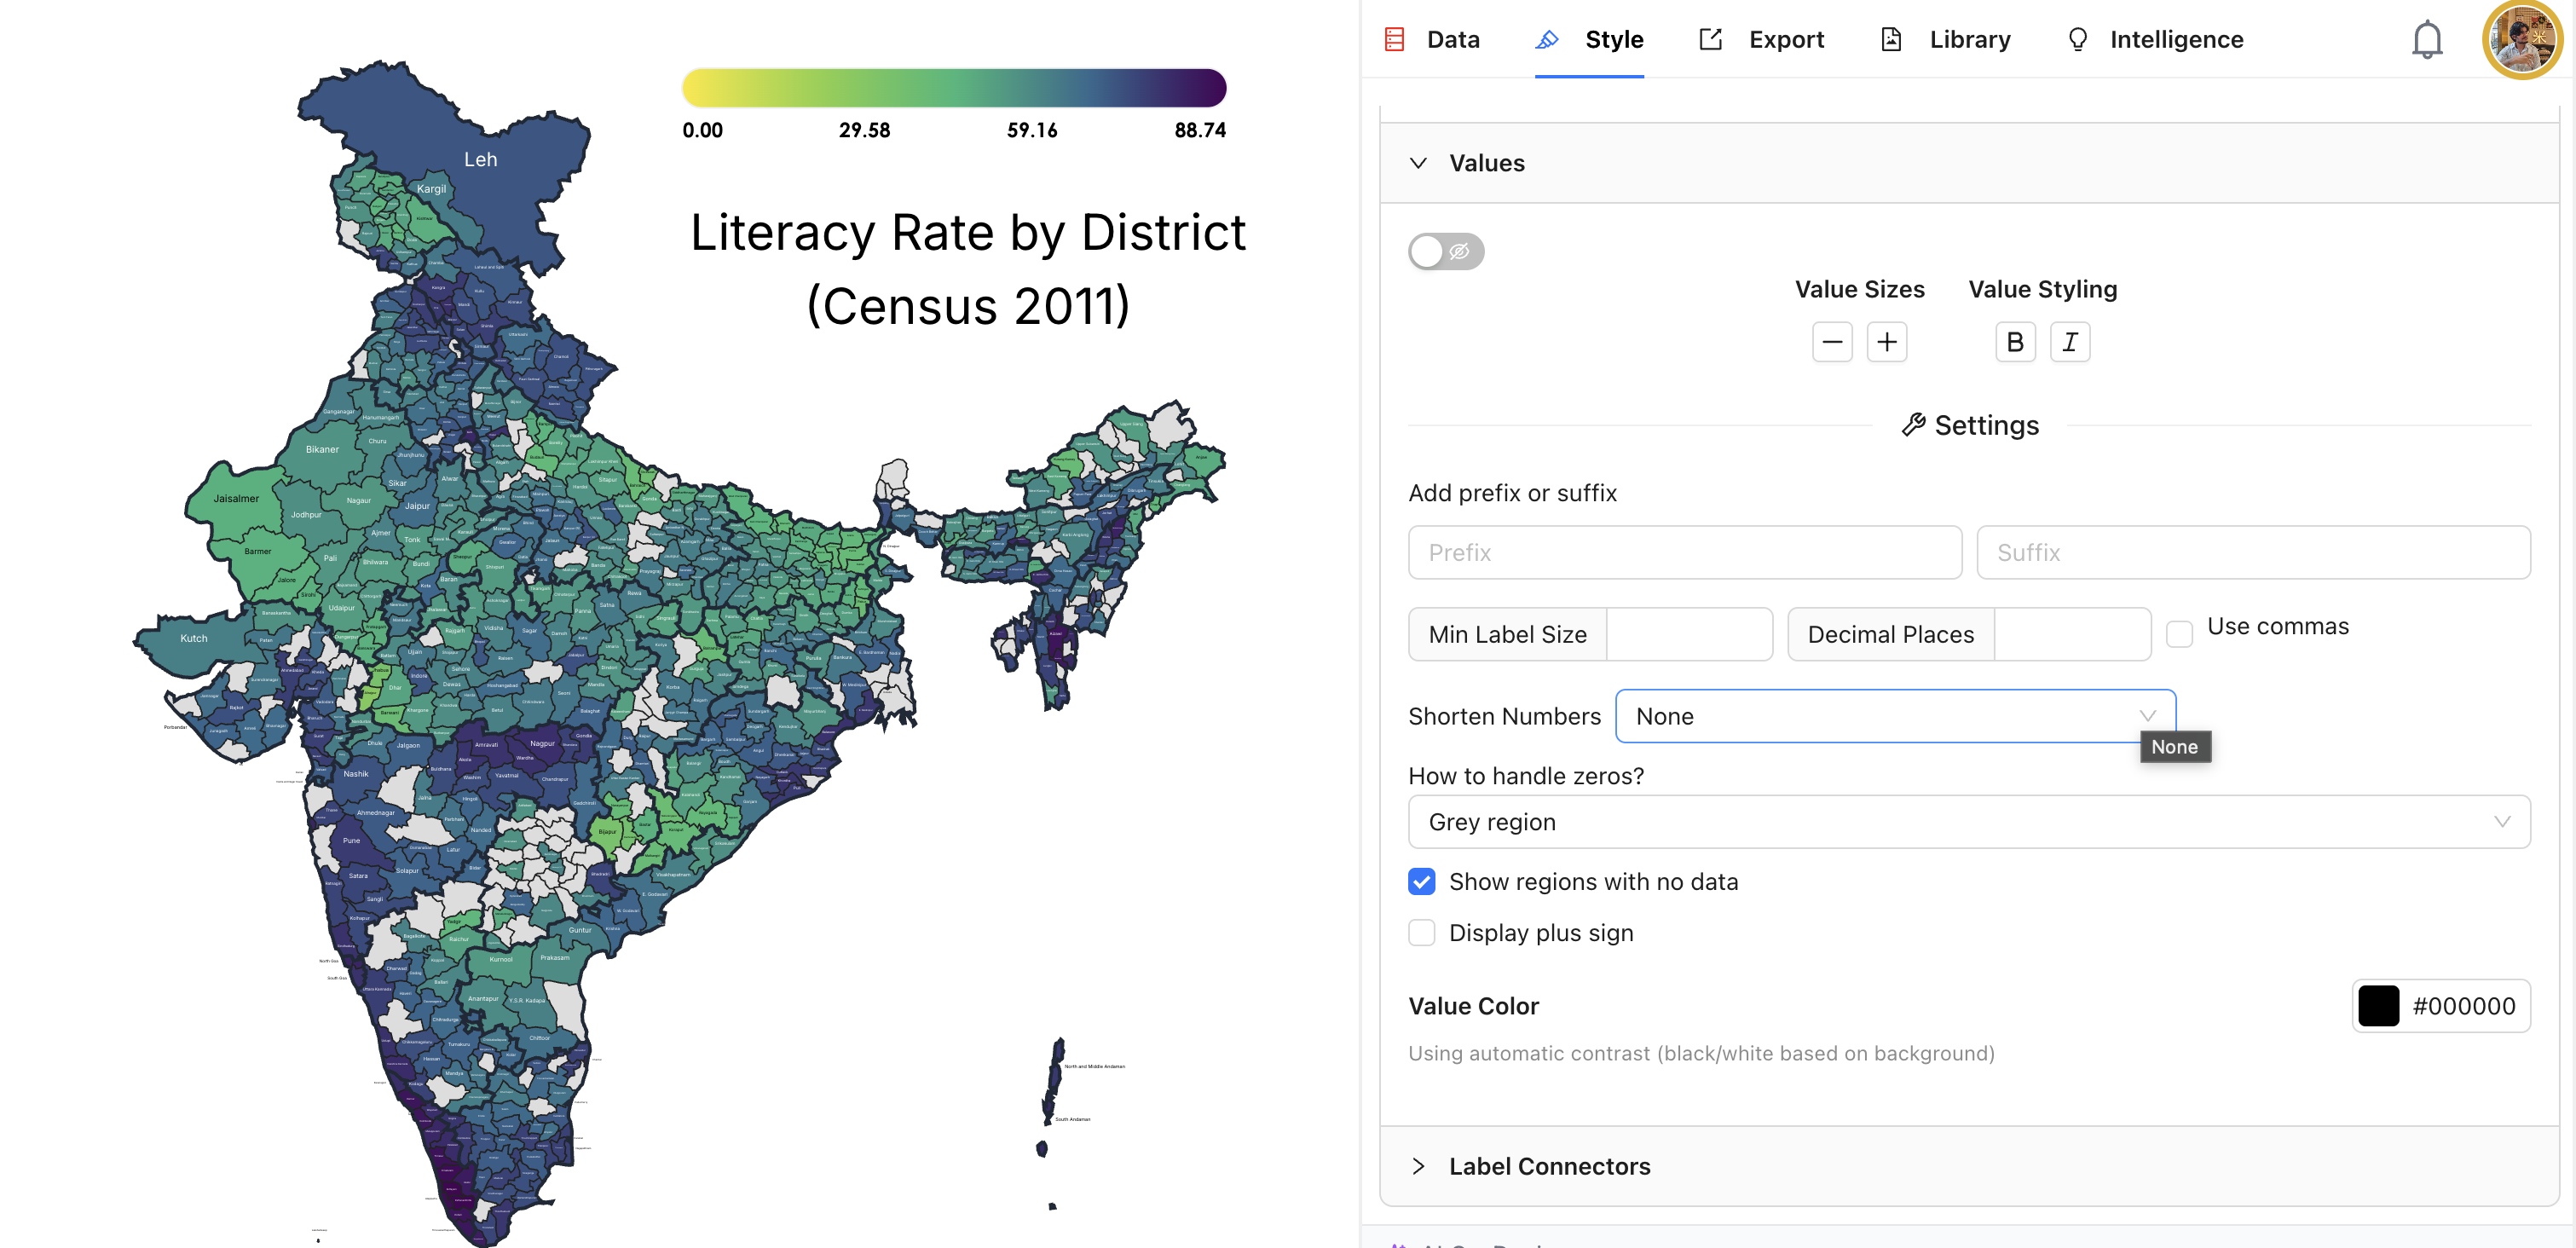
How to turn IMD's rainfall PDF into a live map that updates itself
A step-by-step tutorial: take IMD's state-wise rainfall PDF, put two columns in a Google Sheet, link the sheet to an India map in iipmaps, and publish one embed code that keeps itself current.

October 23, 2026
In 30 seconds
7 steps, about 15 minutes: IMD's PDF, a two-column Google Sheet, an India map in iipmaps, then one embed code on your page.
The map below is live. It reads from a Google Sheet, so when the sheet changes, every page that shows the map changes too.
What it shows: from 1 to 21 October 2026, 28 of 36 states and union territories got less rain than normal, and India as a whole got 58% less.
Source: India Meteorological Department, state-wise rainfall distribution, 1-21 October 2026. This map was made with the steps below.
India Meteorological Department (IMD) publishes rainfall for every state as a PDF, and it rewrites that PDF every day. A screenshot of yesterday's table is out of date by morning. This tutorial turns the same numbers into a map that you embed once and can keep current without touching your page again.
What you need
A Google account, for the sheet.
An iipmaps account. Sign in at iipmaps.com and you land on your dashboard. Linking a Google Sheet to a map works on every plan. The Refresh button, and an embed that keeps following the sheet by itself, need the Pro plan or above.
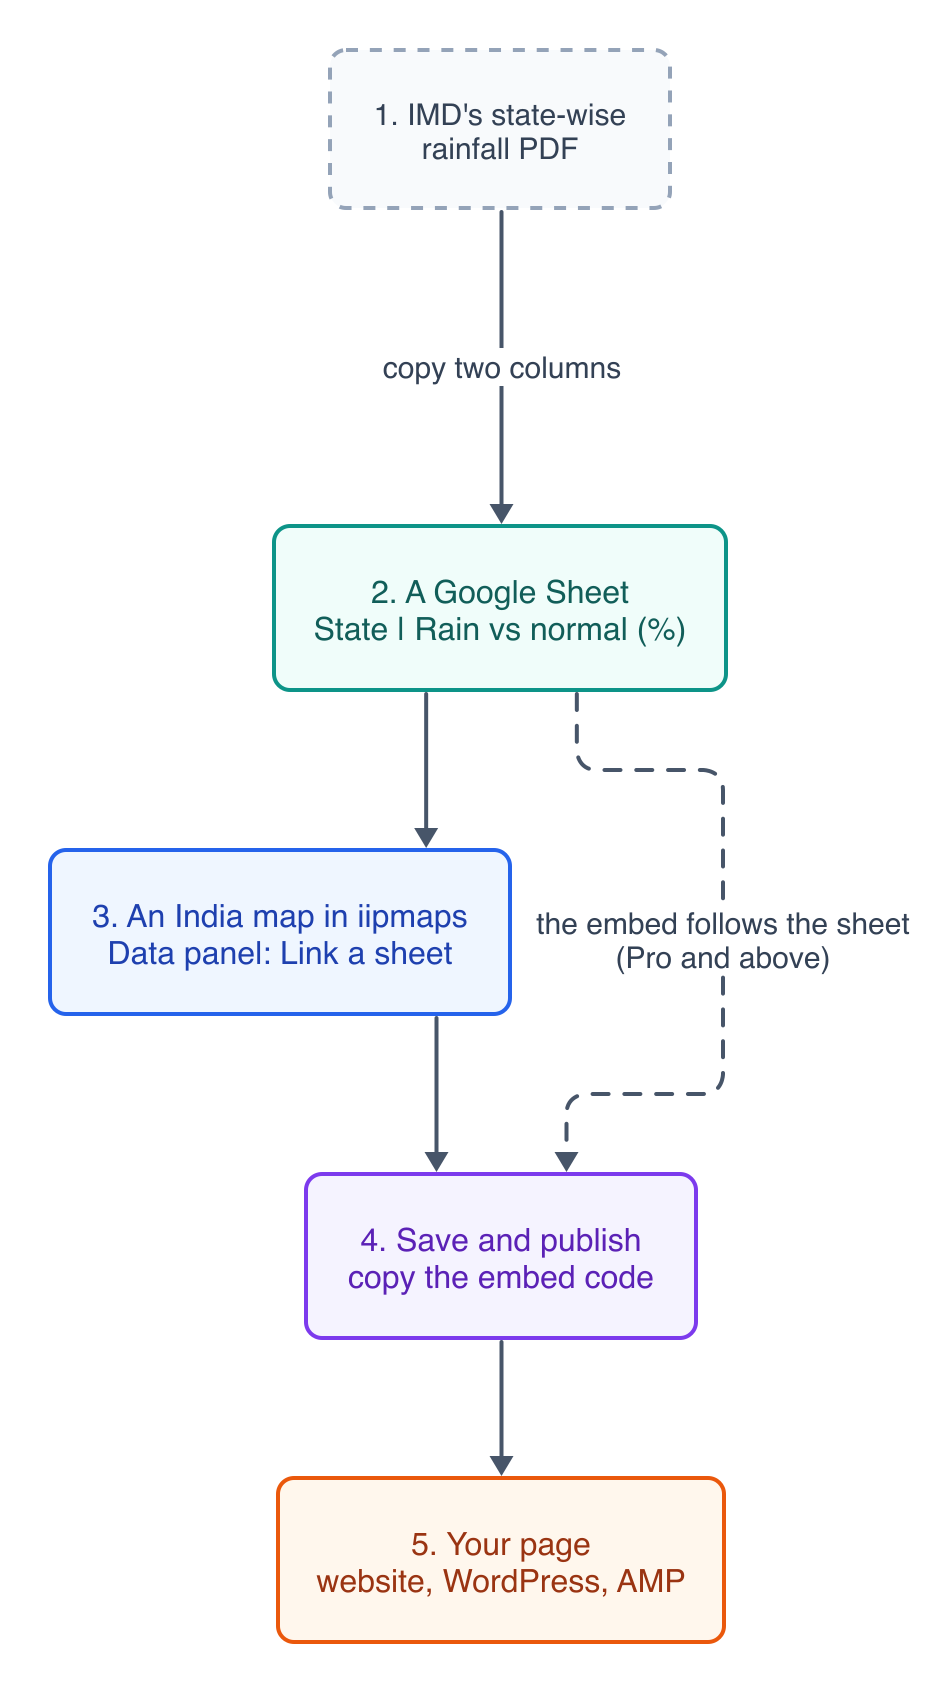
The whole flow. The dashed line is what Pro adds: the published map keeps reading the sheet.
Step 1: Find the column you want in IMD's PDF
The PDF has two blocks of numbers. "DAY" covers a single day. "PERIOD" covers the season so far, which is what most stories need. In each block, "%DEP." is how far rain was from normal: -50% means half the usual rain, +50% means half again as much.
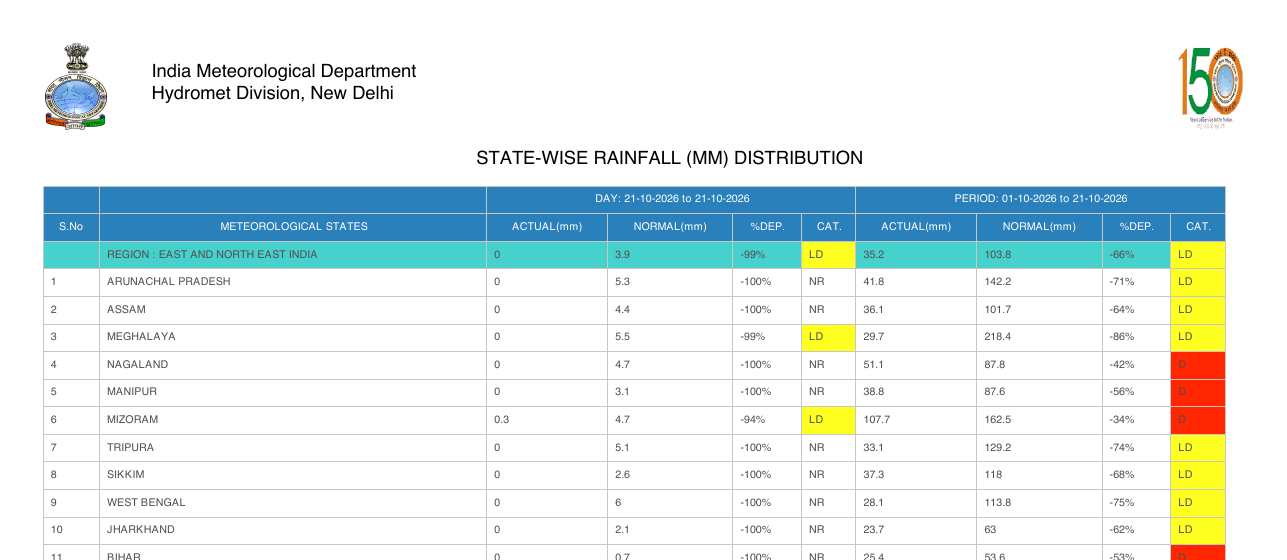
IMD's state-wise rainfall table for 1-21 October 2026. Source: IMD Hydromet Division.
IMD also puts each state in a category: normal is -19% to +19%, deficient is -20% to -59%, and large deficient is -60% or worse. The key is printed at the end of the same PDF.
Step 2: Put two columns in a Google Sheet
Column A is the state, column B the number. Give each column a name in row 1, then one state per row. Write state names the usual way ("Tamil Nadu", "Jammu and Kashmir"), not IMD's spellings ("TAMILNADU", "JAMMU & KASHMIR (UT)"). iipmaps understands many common spellings, but clean names save a step later.
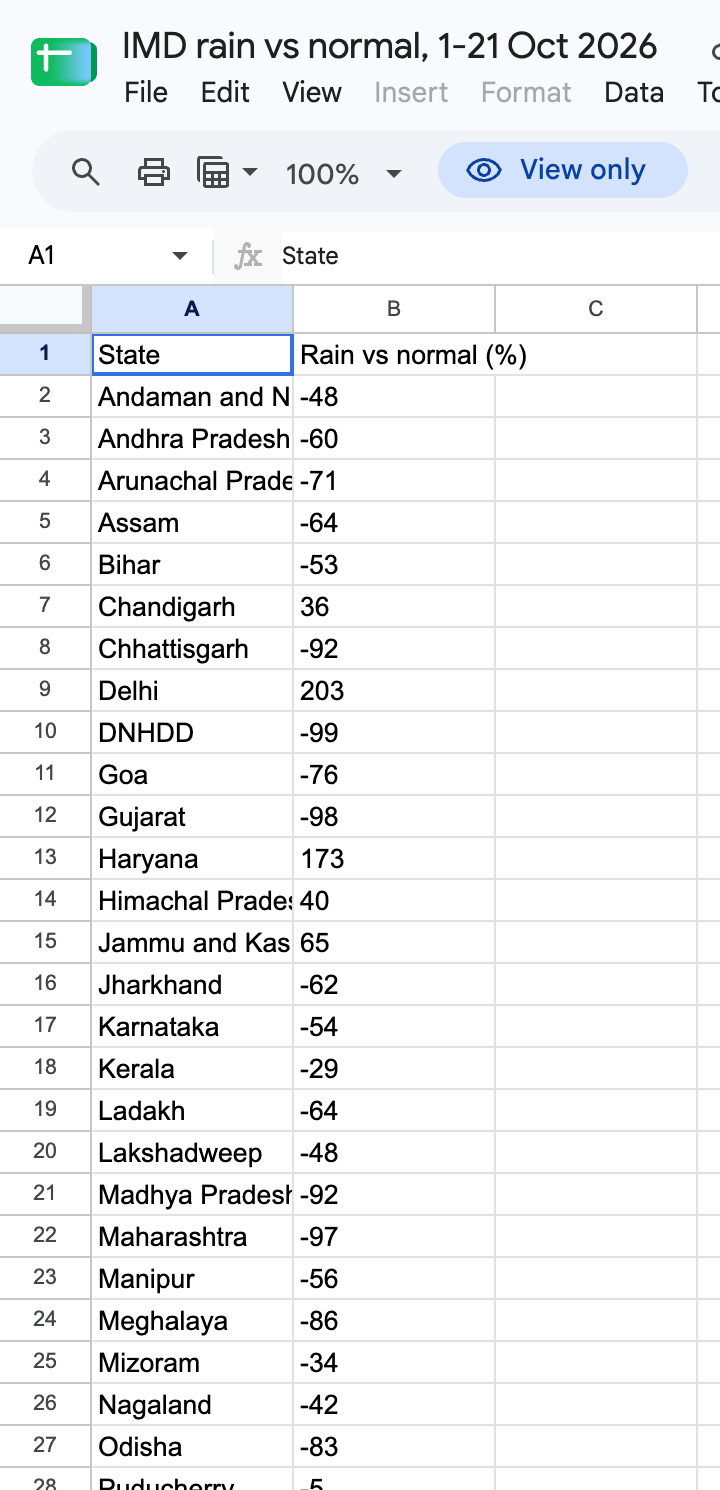
The sheet behind the map above.
Then click Share, set General access to Anyone with the link, as a Viewer, and click Copy link. That link reads the sheet's first tab. If your data is on another tab, open that tab and copy the link from the address bar instead; it ends in #gid= and a number, which tells iipmaps which tab to read.
Step 3: Open an India map and link the sheet
On your dashboard, under Start from a Template, click India. The map opens in the iipmaps editor.
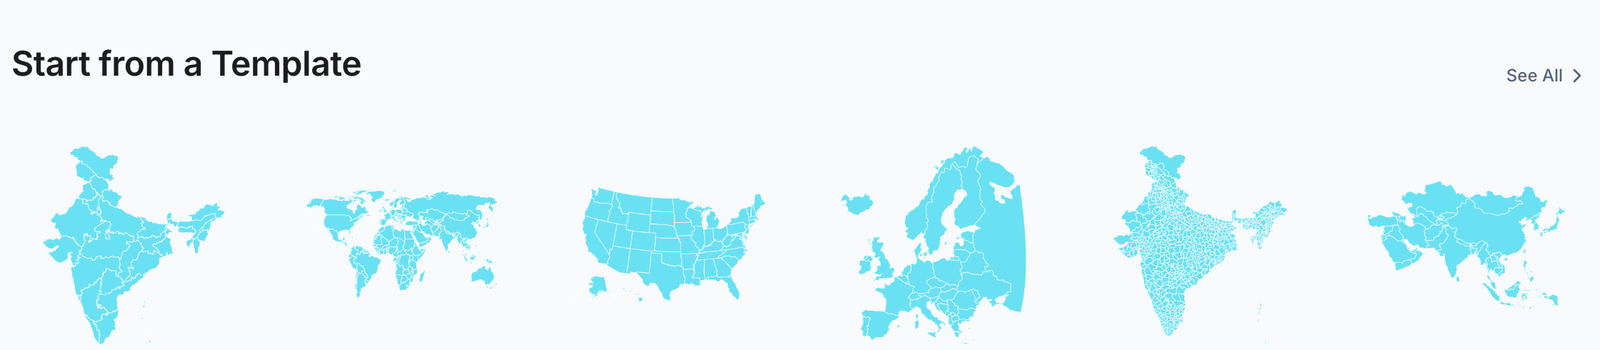
India is the first template on the dashboard.
Open Data in the right-hand rail. In the Import section, click Link a sheet, paste the link from step 2 and click Preview. iipmaps shows the first rows, picks your state column as the Region column and ticks your number under Value columns. Check that it says 36 regions matched, then click Link and import.
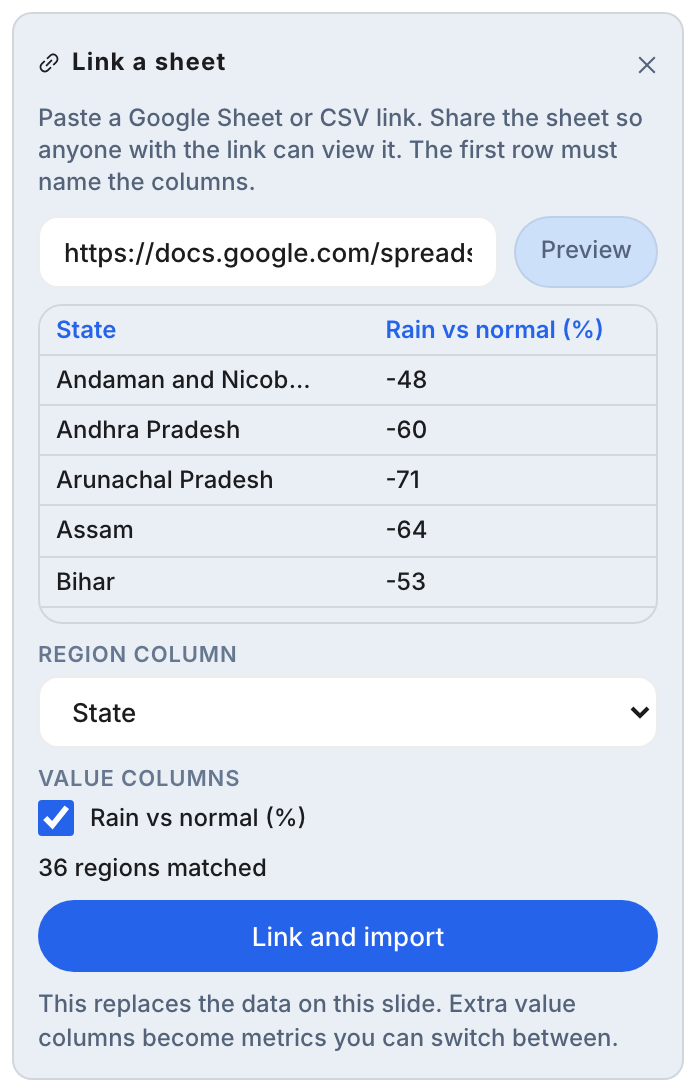
Link a sheet, in the Data panel. Any extra number columns you tick become metrics you can switch between.
Step 4: Check the numbers in the Data panel
The map colours itself straight away. At the top of the Data panel, the Linked sheet card shows the sheet, the columns it reads and when it last fetched. Below it, Values lists every state with its number. Check a few against the PDF.
For numbers that go below and above zero, open Style and pick a colour scale that changes colour in the middle. We used Bengaluru: orange for less rain than normal, teal for more.
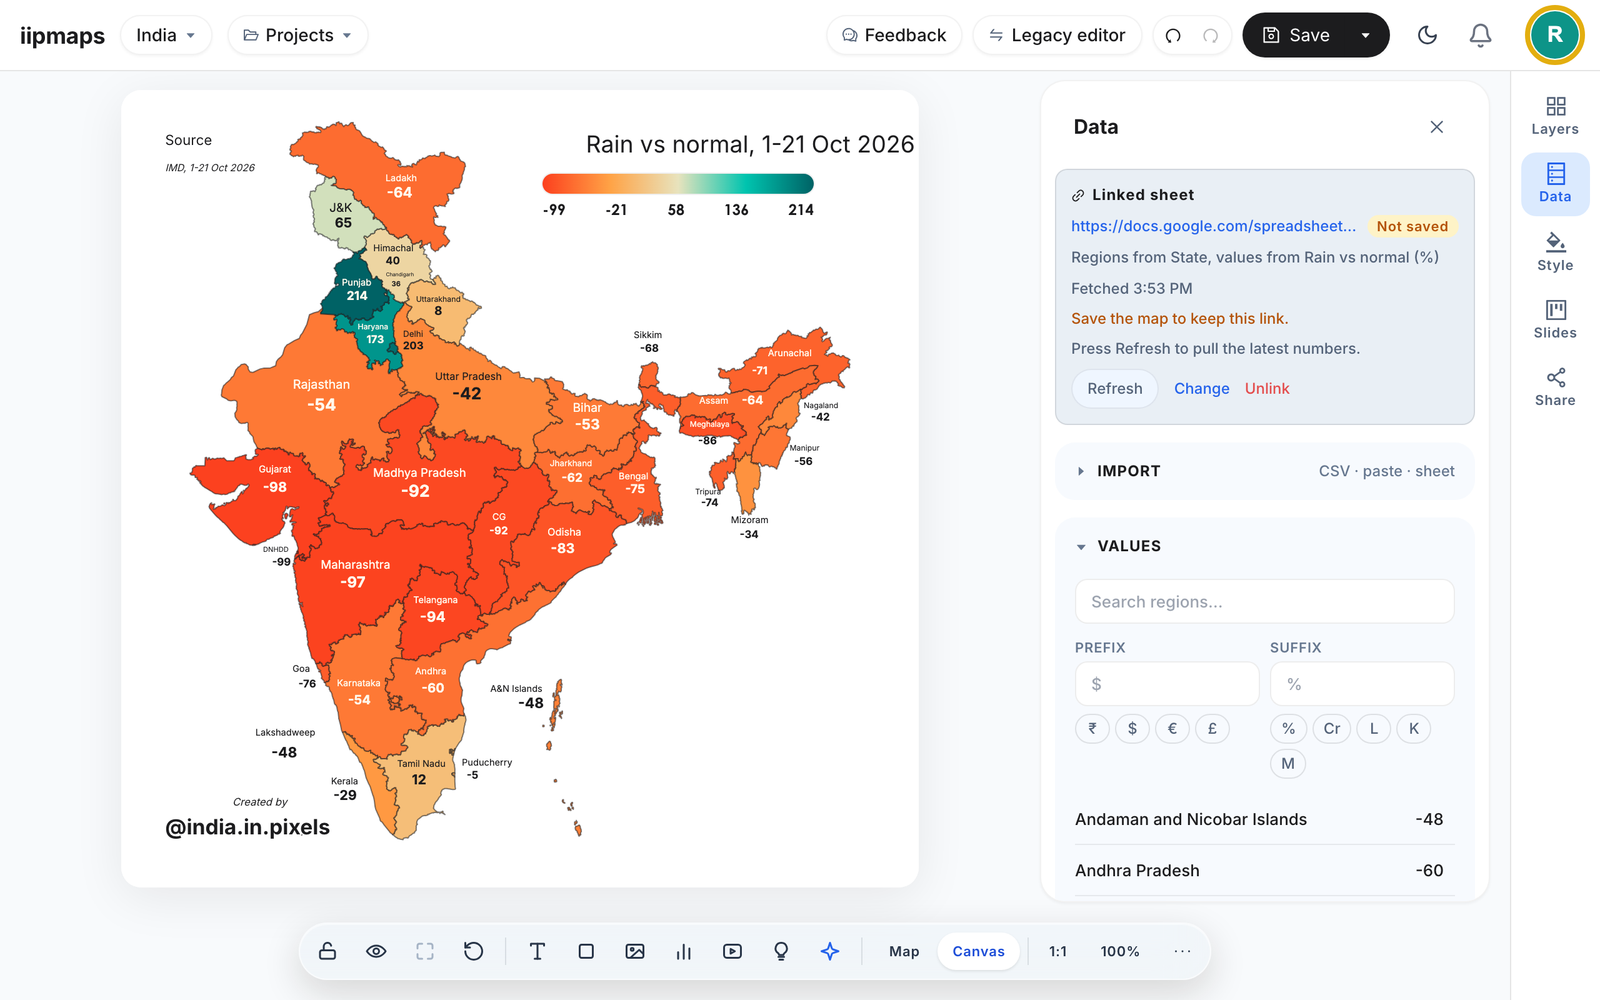
This is how your map will look. "Not saved" means the link and the numbers are kept only once you save, in step 6.
Step 5: Write the title and source
Click the title to rewrite it, and fill in the source line: name the dataset and its dates, as in the map above. The template also has a "Total Figure" text. A total of percentages means nothing, so delete it, or write a figure that does mean something, such as India's -58%.
Step 6: Save the map
Click Save and give the map a name. Saving keeps the sheet link too: the card changes from Not saved to Saved.
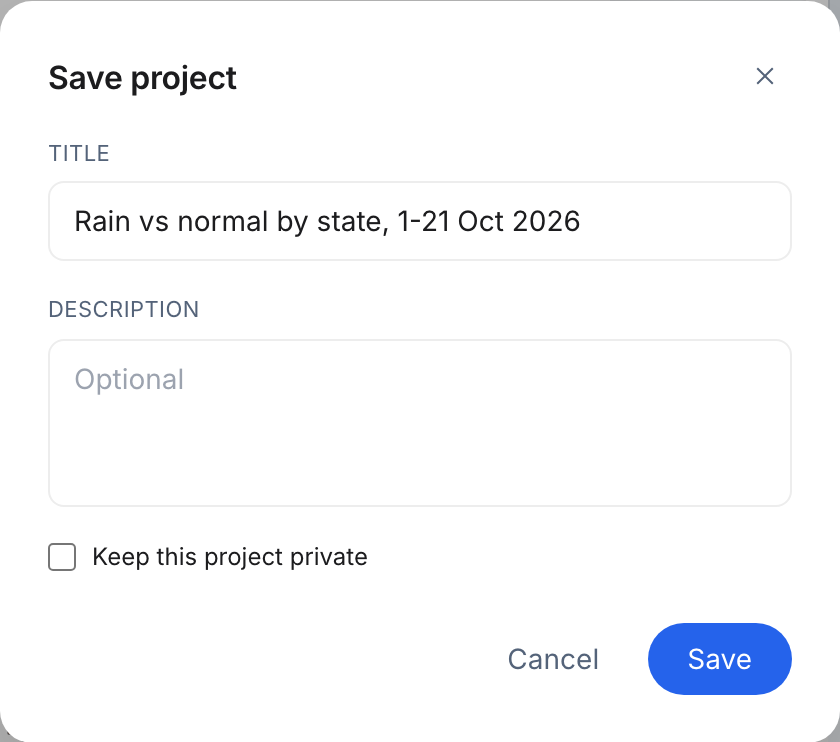
Saving the map. "Keep this project private" is a Pro option.
Step 7: Publish and copy the embed code
Open Share in the right-hand rail and click Publish. When it says "Live, version 1", the map has its own address.
You do not need to link the sheet again. Because the map is already linked, publishing links the embed to the same sheet, and the panel says "The embed now follows your linked sheet".
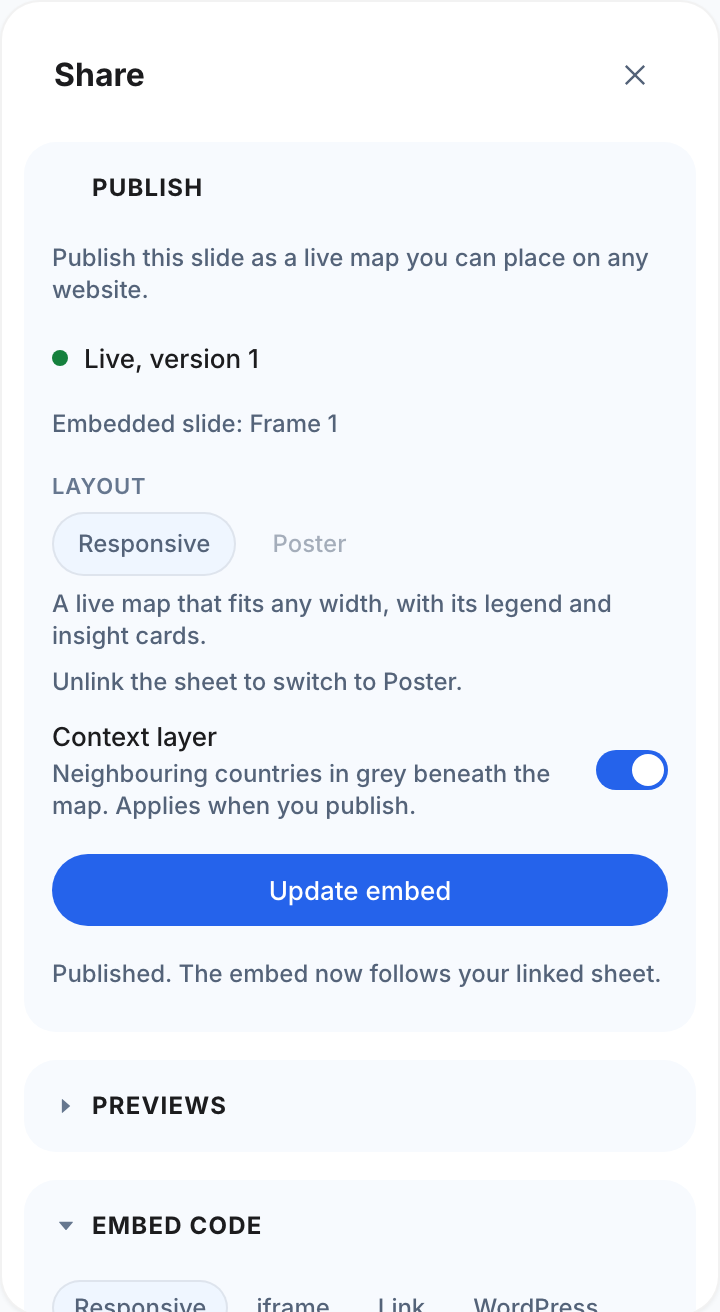
Published, with the embed already following the sheet.
The Embed code section gives you code for your site (Responsive or iframe), a plain link, a WordPress link, an AMP snippet and an image. Paste the code into your page once. The responsive code fits any width and grows to the map's height. Readers get zoom and search controls and a data table for screen readers, and an open page checks for new data every 30 seconds.
From now on, iipmaps re-reads the sheet on its own: every 15 minutes on Pro, every 5 on Team and every minute on Enterprise. When IMD's next PDF comes out, change the numbers in the sheet and the map follows, on every page that shows it. In the editor, press Refresh on the Linked sheet card to see the new numbers; Team and Enterprise maps load them each time you open the map. On the free plan the embed keeps the numbers you published, and you can update it by hand three times.
Common mistakes
The sheet is not shared. iipmaps can only read a sheet set to "Anyone with the link can view".
The map shows another tab's numbers. A plain Copy link reads the first tab. Open the tab you want and use the address bar link, the one ending in
#gid=.A few states stay blank. The preview in step 3 says how many regions matched and lists the names it could not place. Fix those spellings in the sheet.
The card still says "Not saved". New numbers and a new link are kept only when you save the map.
Numbers typed into the title. Text like "28 of 36 states" does not change by itself when the sheet does. iipmaps warns you about it in the Share panel. Update that text when you update the data, or keep numbers out of the title.
The colour scale is locked while a sheet is linked to the embed, so a new week of data keeps the colours your readers already know. Values beyond the ends of the scale use the end colours.
What the map shows
The post-monsoon weeks of 2026 started dry. From 1 to 21 October, India as a whole received 24.8 mm of rain against a normal of 59.3 mm, 58% less, according to IMD's state-wise table. Gujarat (-98%), Maharashtra (-97%) and Telangana (-94%) were among the driest. A band of the north-west was the exception: Punjab got 214% more rain than normal, Delhi 203% and Haryana 173%. October normals there are small, so a few wet days move the percentage a lot.
That follows a weak monsoon: IMD recorded 87% of normal rain for June to September 2026, a "deficient" season. Our post on live maps has the season map, and the reasons newsrooms keep maps like this live.
Frequently asked questions
Can I make the map without a Google Sheet?
Yes. In the Data panel you can also upload a CSV file or paste the table. You only need a sheet if you want the map to update itself after you publish it.
Do I have to link the embed to the sheet separately?
No. When the map is linked to a sheet, publishing it on Pro or above links the embed too. The Linked data section of the Share panel shows that link, with Refresh now and Unlink.
Does the embed work on WordPress and AMP pages?
Yes. The Share panel has a WordPress link and an AMP snippet next to the normal embed code. In WordPress, pasting the link on its own line is enough.
What happens if my sheet has a mistake?
Fix the sheet and the published map picks it up at the next check. You can also click Refresh now under Linked data in the Share panel. If a check fails three times in a row, iipmaps tells you and the map keeps its last good data.
Sources
India Meteorological Department, Hydromet Division: State-wise rainfall (mm) distribution, copy for 1-21 October 2026, including the category key.
India Meteorological Department: Salient Features of the 2026 Southwest Monsoon Season (30 September 2026), for the 87% season figure.